WDC Western Digital Corporation
Information Technology, filed as WESTERN DIGITAL CORP (COM), Equity Among managers we track Quote on Google Finance, opens in a new tab
No current holdings among managers we track for this security. See ownership history or the ownership grid, activity, or search.
Insider trades
Open-market buys and sales by WDC's executives, directors and 10% owners in the last 12 months, from their Form 4s
- None no insider bought on the open market
- $19M sold by 6 insiders outside a trading plan
- $56.3M sold by 5 insiders under 10b5-1 plans
-
Cynthia L Tregillis Chief Legal Officer & Corp SecPlanned sale$307K 807 shares at $380.00 0.7% of stakeTraded Oct 21 Filed Oct 22
-
Cynthia L Tregillis Chief Legal Officer & Corp SecPlanned sale$195K 432 shares at $451.20 0.4% of stakeTraded Sep 4 Filed Sep 8
-
Vidyadhara K Gubbi Chief of Global OperationsSale$825K 1,795 shares at $459.87 2.2% of stakeTraded Sep 4 Filed Sep 8
-
Stephanie A Streeter DirectorSale$2.5M 5,600 shares at $449.87 14% of stakeTraded Aug 31–Sep 1 Filed Sep 2
-
Cynthia L Tregillis Chief Legal Officer & Corp SecPlanned sale$696K 1,483 shares at $469.51 1.3% of stakeTraded Aug 26–27 Filed Aug 27
-
Cynthia L Tregillis Chief Legal Officer & Corp SecPlanned sale$417K 919 shares at $454.12 0.8% of stakeTraded Aug 21–24 Filed Aug 24
-
Irving Tan CEOPlanned sale$8.9M 20,000 shares at $444.97 3.4% of stakeTraded Aug 11 Filed Aug 12
-
Martin I Cole DirectorPlanned sale$89K 192 shares at $462.77 0.9% of stakeTraded Jul 28 Filed Jul 29
-
Martin I Cole DirectorPlanned sale$1.7M 3,808 shares at $448.66 15% of stakeTraded Jul 28 Filed Jul 29
-
Cynthia L Tregillis Chief Legal Officer & Corp SecPlanned sale$428K 808 shares at $529.63 0.7% of stakeTraded Jul 21 Filed Jul 21
-
Martin I Cole DirectorPlanned sale$386K 720 shares at $536.01 2.8% of stakeTraded Jun 9 Filed Jun 11
-
Martin I Cole DirectorPlanned sale$1.7M 3,280 shares at $511.16 11% of stakeTraded Jun 9 Filed Jun 11
-
Cynthia L Tregillis Chief Legal Officer & Corp SecPlanned sale$236K 432 shares at $545.60 0.4% of stakeTraded Jun 5 Filed Jun 5
-
Vidyadhara K Gubbi Chief of Global OperationsSale$1.4M 2,475 shares at $556.24 2.8% of stakeTraded Jun 1 Filed Jun 2
-
Bruce E Kiddoo DirectorSale$396K 750 shares at $528.52 16% of stakeTraded May 28 Filed May 29
Also filed in the last 12 months, not counted as buying or selling: 88 option exercises, 82 share withholdings for taxes, 16 stock grants, 4 gifts, and 2 other transactions.
Congress
4 members of Congress traded WDC in the last three years: 3 buys and 5 sales. 4 members listed it in 2025 annual reports.
-
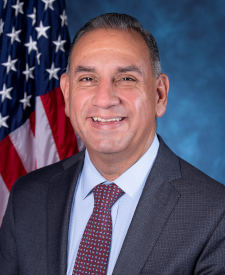 Gilbert Ray Cisneros, Jr.
Sell
$1K–$15K
Sep 18
filed Oct 12
-
Gilbert Ray Cisneros, Jr.
Buy
$1K–$15K
Jul 17
filed Sep 4
- Alan Armstrong Buy $1K–$15K Mar 27 filed Jul 21
-
 Jefferson Shreve
Sell
$15K–$50K
May 12, 2025
filed Jun 22, 2025
-
Jefferson Shreve
Buy
$15K–$50K
Apr 17, 2025
filed May 8, 2025
-
 Robert P. Bresnahan, Jr.
Sell
$1K–$15K
Apr 11, 2025
filed May 8, 2025
SEC filings
Recent issuer filings from EDGAR, 7 shown.
Financials
US-GAAP annual figures by fiscal year, as tagged in Form 10-K. Each value links to its SEC filing.
Income statement
Balance sheet
| Metric | FY2023 | FY2024 | FY2025 | FY2026 |
|---|---|---|---|---|
| Total current assets | $7.89B | $8.06B | $5.86B | $5.63B |
| Total non-current assets * | $16.54B | $16.13B | $8.15B | $8.23B |
| Total assets | $24.43B | $24.19B | $14B | $13.86B |
| Total current liabilities | $5.43B | $6.09B | $5.42B | $4.24B |
| Total non-current liabilities * | $7.27B | $7.05B | $3.04B | $0.757B |
| Total equity | $10.85B | $10.82B | $5.31B | $8.86B |
Ownership over time
13Fs that reported it each quarter. Click a bar for that quarter’s holders.