VSAT Viasat Inc.
Information Technology, filed as VIASAT INC (COM), Equity As of 2026 Q2 among managers we track Quote on Google Finance, opens in a new tab
In 2026 Q2 Howard Marks, Senator Investment Group, and Davidson Kempner Capital Management opened positions in Viasat.
Who owns this now
Largest portfolio weights among holders, up to 0.8% (Howard Marks, Oaktree Capital Management). Not free-float ownership.
Who owns VSAT
Sorted by value, long equity only, as of 2026 Q2.
| History | |||||
|---|---|---|---|---|---|
| Howard Marks, Oaktree Capital Management | New 0.79% | 630,280 | $57M | History | |
| Davidson Kempner Capital Management | New 0.32% | 300,000 | $27M | History | |
| Senator Investment Group | New 0.59% | 180,000 | $16M | History | |
| Mairs & Power | Hold | 13,000 | $1.2M | History |
Insider trades
Open-market buys and sales by VSAT's executives, directors and 10% owners in the last 12 months, from their Form 4s
- None no insider bought on the open market
- $24.2M sold by 4 insiders outside a trading plan
- $47.2M sold by 8 insiders under 10b5-1 plans
-
Garrett L. Chase CFOPlanned sale$235K 4,000 shares at $58.86 7.8% of stakeTraded Oct 20 Filed Oct 22
-
Craig Andrew Miller SVP, Pres Viasat GovernmentPlanned sale$852K 11,893 shares at $71.61 22% of stakeTraded Oct 9 Filed Oct 13
-
Benjamin Edward Palmer SVP, Pres CommercialPlanned sale$140K 2,000 shares at $69.87 6.6% of stakeTraded Oct 1 Filed Oct 5
-
Garrett L. Chase CFOPlanned sale$308K 4,000 shares at $76.91 7.2% of stakeTraded Sep 21 Filed Sep 23
-
John P Stenbit DirectorPlanned sale$47K 705 shares at $66.75 56% of stakeTraded Sep 1 Filed Sep 3
-
Benjamin Edward Palmer SVP, Pres CommercialPlanned sale$134K 2,000 shares at $66.75 6.2% of stakeTraded Sep 1 Filed Sep 3
-
Garrett L. Chase CFOPlanned sale$300K 4,000 shares at $74.90 13% of stakeTraded Aug 20 Filed Aug 24
-
Richard A Baldridge DirectorSale$18M 223,542 shares at $80.62 100% of stakeTraded Aug 7 Filed Aug 11
-
Robert James Blair SVP, General CounselSale$2.2M 27,064 shares at $79.76 55% of stakeTraded Aug 7 Filed Aug 11
-
Theresa Wise DirectorPlanned sale$212K 2,500 shares at $84.69 19% of stakeTraded Aug 4 Filed Aug 6
-
Benjamin Edward Palmer SVP, Pres CommercialPlanned sale$181K 2,400 shares at $75.46 10% of stakeTraded Aug 3 Filed Aug 5
-
John P Stenbit DirectorPlanned sale$46K 616 shares at $75.46 49% of stakeTraded Aug 3 Filed Aug 5
-
Garrett L. Chase CFOPlanned sale$289K 4,000 shares at $72.23 12% of stakeTraded Jul 20 Filed Jul 22
-
John P Stenbit DirectorPlanned sale$47K 528 shares at $88.79 42% of stakeTraded Jul 1 Filed Jul 6
-
Benjamin Edward Palmer SVP, Pres CommercialPlanned sale$213K 2,400 shares at $88.79 9.2% of stakeTraded Jul 1 Filed Jul 6
Also filed in the last 12 months, not counted as buying or selling: 61 option exercises, 36 share withholdings for taxes, 26 gifts, and 1 other transaction.
Congress
2 members of Congress traded VSAT in the last three years: 2 buys and 3 sales. 1 member listed it in 2025 annual reports.
-
 Jonathan L. Jackson
Sell
$50K–$100K
Sep 28
filed Oct 19
-
Jonathan L. Jackson
Partial sale
$1K–$15K
Aug 28
filed Sep 3
-
Jonathan L. Jackson
Buy
$50K–$100K
Jan 22
filed Feb 23
-
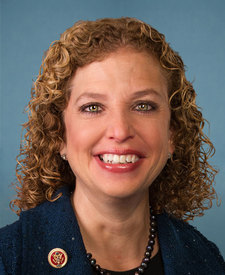 Debbie Wasserman Schultz
Sell
$1K–$15K
Jul 18, 2025
filed Jul 25, 2025
-
Debbie Wasserman Schultz
Buy
$1K–$15K
Oct 23, 2024
filed Nov 20, 2024
SEC filings
Recent issuer filings from EDGAR, 2 shown.
Financials
US-GAAP annual figures by fiscal year, as tagged in Form 10-K. Each value links to its SEC filing.
Income statement
Balance sheet
| Metric | FY2023 | FY2024 | FY2025 | FY2026 |
|---|---|---|---|---|
| Total current assets | $2.24B | $3.48B | $2.89B | $3.12B |
| Total non-current assets * | $5.49B | $12.85B | $12.56B | $12.1B |
| Total assets | $7.73B | $16.33B | $15.45B | $15.23B |
| Total current liabilities | $0.957B | $1.3B | $1.68B | $1.3B |
| Total non-current liabilities * | $2.91B | $9.96B | $9.13B | $9.2B |
| Total equity | $3.82B | $5.03B | $4.55B | $4.66B |
Ownership over time
13Fs that reported it each quarter. Click a bar for that quarter’s holders.