URI Sunbelt Rentals Holdings Inc.
Industrials, filed as SUNBELT RENTALS HOLDINGS INC (SHS), Equity As of 2026 Q2 among managers we track Quote on Google Finance, opens in a new tab
Bought by 3 managers in 2026 Q2, sold by 9
- 14 Owners
- #50
- Max 10.6%
- Master 0.38%
- $6.5B
- 1 new 1 add 8 reduce 3 small
In 2026 Q2, 1 manager opened a position, 1 added, and 8 trimmed.
Who owns this now
Largest portfolio weights among holders, up to 10.6% (Ako Capital). Not free-float ownership.
Who owns URI
Sorted by value, long equity only, as of 2026 Q2.
| History | |||||
|---|---|---|---|---|---|
| Dodge & Cox | Small add +3.1% | 54,761,610 | $4.1B | History | |
| Bill Nygren / Oakmark, Harris Associates L P | Reduce −10.2% | 10,461,105 | $783M | History | |
| Ako Capital | Add +90.7% | 6,074,817 | $454M | History | |
| Thomas Russo, Gardner Russo & Quinn | Small trim −2.5% | 5,897,825 | $441M | History | |
| Ruane, Cunniff & Goldfarb | Reduce −22.4% | 4,261,163 | $319M | History | |
| Abrams Bison, Abrams Bison Investments | Reduce −83.6% | 2,058,758 | $154M | History | |
| Pat Dorsey, Dorsey Asset Management | Reduce −47.8% | 1,150,578 | $86M | History | |
| Thomas Gayner, Markel Group | Small add +1.1% | 974,361 | $73M | History | |
| George Soros, Soros Fund Management | Reduce −5.5% | 516,034 | $39M | History | |
| Francois Rochon, Giverny Capital | Reduce −9.0% | 246,369 | $22M | History | |
| Lyrical Asset Management | Reduce −8.5% | 174,820 | $13M | History | |
| Glenn Greenberg, Brave Warrior Advisors | Hold | 23,762 | $1.8M | History | |
| Christopher Bloomstran, Semper Augustus Investments Group | New 0.02% | 2,774 | $208K | History | |
| First Eagle Investment Management | Reduce −73.9% | 1,868 | $136K | History |
Insider trades
Open-market buys and sales by URI's executives, directors and 10% owners in the last 12 months, from their Form 4s
- $53K bought by 1 insider
- $30.5M sold by 6 insiders outside a trading plan
- None no planned (10b5-1) sales
-
William E. Grace CFOSale$1.7M 1,500 shares at $1,133.15 20% of stakeTraded Jul 24 Filed Jul 24
-
Joli L. Gross SVP, Chief LGL & Sustain. Off.Sale$292K 306 shares at $954.99 5.1% of stakeTraded Apr 27 Filed Apr 27
-
Craig Adam Pintoff EVP, Chief Admin. OfficerSale$2.4M 2,466 shares at $963.00 14% of stakeTraded Apr 27 Filed Apr 27
-
Andrew B. Limoges VP, ControllerSale$536K 548 shares at $977.86 23% of stakeTraded Apr 24 Filed Apr 24
-
Matthew John Flannery CEOSale$22.4M 22,768 shares at $984.98 19% of stakeTraded Apr 24 Filed Apr 24
-
Shiv Singh DirectorBuy$53K 68 shares at $783.36 +0.9% to stakeTraded Feb 2 Filed Feb 9
-
William E. Grace CFOSale$1.2M 1,498 shares at $790.89 18% of stakeTraded Feb 3 Filed Feb 9
-
Michael D Durand COOSale$2M 2,490 shares at $791.14 25% of stakeTraded Feb 2 Filed Feb 2
Also filed in the last 12 months, not counted as buying or selling: 38 share withholdings for taxes, 36 stock grants, and 2 sales back to the company.
Congress
8 members of Congress traded URI in the last three years: 10 buys and 10 sales. 9 members listed it in 2025 annual reports.
-
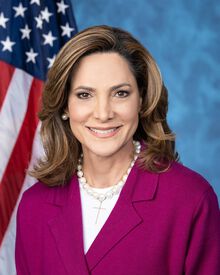 Maria Elvira Salazar
Partial sale
$1K–$15K
Sep 24
filed Oct 7
- Alan Armstrong Buy $1K–$15K Mar 27 filed Jul 21
-
Maria Elvira Salazar
Buy
$1K–$15K
Apr 24
filed May 8
-
Maria Elvira Salazar
Buy
$1K–$15K
Mar 25
filed Apr 21
-
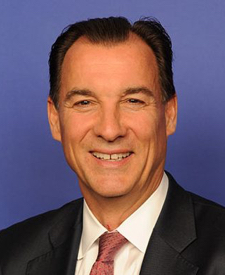 Thomas R. Suozzi
Sell
$15K–$50K
Feb 18
filed Mar 17
-
 Julia Letlow
Sell
$1K–$15K
Feb 2
filed Mar 12
SEC filings
Recent issuer filings from EDGAR, 14 shown.
| Filed | Form | Detail | Links |
|---|---|---|---|
| 424B2 | Filing Doc | ||
| 10-Q | Filing Doc | ||
| 8-K | 2.02,7.01,9.01 | Filing Doc | |
| 8-K | 7.01,9.01 | Filing Doc | |
| 10-Q | Filing Doc | ||
| 8-K | 2.02,7.01,9.01 | Filing Doc | |
| 8-K | 1.01,2.03,9.01 | Filing Doc | |
| 8-K | 5.07,9.01 | Filing Doc | |
| SCHEDULE 13G | — | Filing Doc | |
| 10-Q | Filing Doc | ||
| 8-K | 2.02,7.01,9.01 | Filing Doc | |
| SCHEDULE 13G/A | — | Filing Doc | |
| DEF 14A | Filing Doc | ||
| DEFA14A | Filing Doc |
No filings match this filter.
Financials
US-GAAP annual figures by fiscal year, as tagged in Form 10-K. Each value links to its SEC filing.
Income statement
Balance sheet
Ownership over time
13Fs that reported it each quarter. Click a bar for that quarter’s holders.