LRCX Lam Research
Information Technology, filed as LAM RESEARCH CORP (COM NEW), Equity As of 2026 Q3 among managers we track Quote on Google Finance, opens in a new tab
Bought by 7 managers in 2026 Q2, sold by 7
- #55
- Master 0.39%
- 1 exit
In 2026 Q3 Murphy Pohlad sold out of Lam Research.
Who owns LRCX
Sorted by value, long equity only, as of 2026 Q3. Exits show their last held size.
| History | |||||
|---|---|---|---|---|---|
| Murphy Pohlad, Murphy Pohlad Asset Management exited 2026 Q3 Last 2026 Q2 | Exit −0.08% | 530 | $230K | History |
Insider trades
Open-market buys and sales by LRCX's executives, directors and 10% owners in the last 12 months, from their Form 4s
- None no insider bought on the open market
- $41.7M sold by 4 insiders outside a trading plan
- $128M sold by 7 insiders under 10b5-1 plans
-
Bethany Mayer DirectorSale$3M 9,557 shares at $314.74 31% of stakeTraded Sep 9 Filed Sep 10
-
Timothy Archer CEOPlanned sale$9.6M 30,000 shares at $319.26 2.7% of stakeTraded Sep 9 Filed Sep 10
-
Seshasayee Varadarajan Senior Vice PresidentPlanned sale$17.4M 59,750 shares at $291.32 23% of stakeTraded Sep 2 Filed Sep 3
-
Ava Harter Chief Legal OfficerPlanned sale$1.5M 5,000 shares at $302.46 11% of stakeTraded Aug 31 Filed Sep 1
-
Timothy Archer CEOPlanned sale$9M 30,000 shares at $300.00 2.7% of stakeTraded Aug 6 Filed Aug 7
-
Abhijit Y Talwalkar DirectorPlanned sale$6.1M 18,282 shares at $335.00 17% of stakeTraded Jul 13 Filed Jul 14
-
Timothy Archer CEOPlanned sale$11.7M 30,000 shares at $390.01 2.7% of stakeTraded Jul 2 Filed Jul 6
-
Eric Brandt DirectorPlanned sale$20M 54,500 shares at $367.18 27% of stakeTraded Jun 12 Filed Jun 15
-
Eric Brandt DirectorPlanned sale$19.1M 54,500 shares at $350.80 22% of stakeTraded Jun 11 Filed Jun 15
-
Neil J Fernandes Senior Vice PresidentPlanned sale$2.4M 7,659 shares at $309.60 12% of stakeTraded Jun 1 Filed Jun 2
-
Neil J Fernandes Senior Vice PresidentPlanned sale$4.6M 18,170 shares at $255.14 22% of stakeTraded May 1 Filed May 4
-
Ava Harter Chief Legal OfficerSale$1.6M 6,010 shares at $258.66 10% of stakeTraded Apr 27 Filed Apr 28
-
Ava Harter Chief Legal OfficerSale$334K 1,500 shares at $222.66 2.7% of stakeTraded Mar 4 Filed Mar 5
-
Douglas R Bettinger CFOSale$11.2M 50,057 shares at $224.03 4.4% of stakeTraded Mar 4 Filed Mar 5
-
Ava Harter Chief Legal OfficerSale$930K 4,000 shares at $232.50 6.8% of stakeTraded Mar 2 Filed Mar 3
Also filed in the last 12 months, not counted as buying or selling: 33 share withholdings for taxes, 20 option exercises, 19 stock grants, and 6 gifts.
Congress
21 members of Congress traded LRCX in the last three years: 21 buys and 42 sales. 15 members listed it in 2025 annual reports.
-
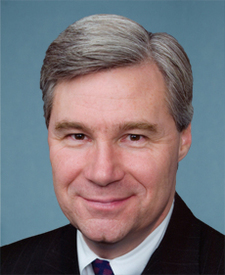 Sheldon Whitehouse
Partial sale
$1K–$15K
Aug 13
filed Sep 2
- Alan Armstrong Buy $1K–$15K Mar 30 filed Jul 21
- Alan Armstrong Buy $1K–$15K Mar 27 filed Jul 21
-
 David J. Taylor
Sell
$1K–$15K
Jun 5
filed Jun 12
-
David J. Taylor
Sell
$1K–$15K
Apr 27
filed May 7
-
David J. Taylor
Sell
$1K–$15K
Apr 27
filed May 7
SEC filings
Recent issuer filings from EDGAR, 11 shown.
Financials
US-GAAP annual figures by fiscal year, as tagged in Form 10-K. Each value links to its SEC filing.
Income statement
Balance sheet
| Metric | FY2023 | FY2024 | FY2025 | FY2026 |
|---|---|---|---|---|
| Total current assets | $13.23B | $12.88B | $14.52B | $15.61B |
| Total non-current assets * | $5.55B | $5.86B | $6.83B | $7.92B |
| Total assets | $18.78B | $18.74B | $21.35B | $23.53B |
| Total current liabilities | $4.18B | $4.34B | $6.57B | $5.94B |
| Total non-current liabilities * | $6.39B | $5.87B | $4.92B | $5.12B |
| Total equity | $8.21B | $8.54B | $9.86B | $12.47B |
Ownership over time
13Fs that reported it each quarter. Click a bar for that quarter’s holders.