MKTX Marketaxess Holdings Inc.
Financials, filed as MARKETAXESS HLDGS INC (COM), Equity As of 2026 Q2 among managers we track Quote on Google Finance, opens in a new tab
In 2026 Q2 Arnold Van Den Berg, First Eagle Investment Management, and Murray Stahl added to Marketaxess.
Who owns this now
Largest portfolio weights among holders, up to 1.3% (Arnold Van Den Berg, Van Den Berg Management I). Not free-float ownership.
Who owns MKTX
Sorted by value, long equity only, as of 2026 Q2.
| History | |||||
|---|---|---|---|---|---|
| Arnold Van Den Berg, Van Den Berg Management I | Add +65.7% | 52,054 | $5.9M | History | |
| First Eagle Investment Management | Add +225250.0% | 49,577 | $5.6M | History | |
| Murray Stahl, Horizon Kinetics Asset Management | Add +7.2% | 2,254 | $256K | History |
Insider trades
Open-market buys and sales by MKTX's executives, directors and 10% owners in the last 12 months, from their Form 4s
- None no insider bought on the open market
- $1M sold by 1 insider outside a trading plan
- $174K sold by 1 insider under 10b5-1 plans
-
Scott Pintoff General Counsel and SecretaryPlanned sale$16K 100 shares at $164.65 0.9% of stakeTraded Oct 12 Filed Oct 13
-
Scott Pintoff General Counsel and SecretaryPlanned sale$16K 100 shares at $163.32 0.9% of stakeTraded Sep 10 Filed Sep 11
-
William Frank Cruger Jr. DirectorSale$1M 6,164 shares at $163.20 60% of stakeTraded Sep 10 Filed Sep 11
-
Scott Pintoff General Counsel and SecretaryPlanned sale$16K 100 shares at $162.60 0.9% of stakeTraded Aug 10 Filed Aug 10
-
Scott Pintoff General Counsel and SecretaryPlanned sale$12K 100 shares at $115.12 0.8% of stakeTraded Jul 10 Filed Jul 10
-
Scott Pintoff General Counsel and SecretaryPlanned sale$12K 100 shares at $116.03 0.8% of stakeTraded Jun 10 Filed Jun 12
-
Scott Pintoff General Counsel and SecretaryPlanned sale$15K 100 shares at $146.99 0.8% of stakeTraded May 11 Filed May 11
-
Scott Pintoff General Counsel and SecretaryPlanned sale$17K 100 shares at $171.96 0.8% of stakeTraded Apr 10 Filed Apr 10
-
Scott Pintoff General Counsel and SecretaryPlanned sale$18K 100 shares at $184.93 0.8% of stakeTraded Mar 10 Filed Mar 10
-
Scott Pintoff General Counsel and SecretaryPlanned sale$17K 100 shares at $171.91 1% of stakeTraded Feb 10 Filed Feb 10
-
Scott Pintoff General Counsel and SecretaryPlanned sale$17K 100 shares at $168.63 1% of stakeTraded Jan 12 Filed Jan 12
-
Scott Pintoff General Counsel and SecretaryPlanned sale$18K 100 shares at $177.85 1% of stakeTraded Dec 12, 2025 Filed Dec 12, 2025
Also filed in the last 12 months, not counted as buying or selling: 24 stock grants, 12 share withholdings for taxes, and 7 gifts.
Congress
2 members of Congress traded MKTX in the last three years: 1 buy and 2 sales. 1 member listed it in 2025 annual reports.
-
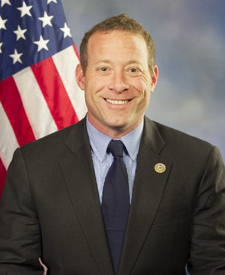 Josh Gottheimer
Sell
$1K–$15K
Apr 9
filed May 19
-
 Julie Johnson
Sell
$1K–$15K
Feb 12, 2025
filed Mar 12, 2025
-
Julie Johnson
Buy
$1K–$15K
Jan 15, 2025
filed Feb 12, 2025
SEC filings
Recent issuer filings from EDGAR, 17 shown.
| Filed | Form | Detail | Links |
|---|---|---|---|
| 8-K | 2.02,8.01,9.01 | Filing Doc | |
| 8-K | 8.01 | Filing Doc | |
| DEFA14A | Filing Doc | ||
| 8-K | 8.01 | Filing Doc | |
| SCHEDULE 13G/A | — | Filing Doc | |
| SCHEDULE 13G/A | — | Filing Doc | |
| 10-Q | Filing Doc | ||
| SCHEDULE 13G/A | — | Filing Doc | |
| 8-K | 1.01,5.02,7.01,9.01 | Filing Doc | |
| DEFA14A | Filing Doc | ||
| 8-K | 2.02,8.01,9.01 | Filing Doc | |
| DEFA14A | Filing Doc | ||
| 8-K | 5.07 | Filing Doc | |
| SCHEDULE 13G | — | Filing Doc | |
| 8-K | 2.02,8.01,9.01 | Filing Doc | |
| 10-Q | Filing Doc | ||
| SCHEDULE 13G/A | — | Filing Doc |
No filings match this filter.
Financials
US-GAAP annual figures by fiscal year, as tagged in Form 10-K. Each value links to its SEC filing.
Income statement
Balance sheet
Ownership over time
13Fs that reported it each quarter. Click a bar for that quarter’s holders.