KD Kyndryl Holdings Inc.
Information Technology, filed as KYNDRYL HLDGS INC (COMMON STOCK), Equity As of 2026 Q2 among managers we track Quote on Google Finance, opens in a new tab
In 2026 Q2 Harry Burn trimmed Kyndryl.
Who owns this now
Largest portfolio weights among holders, up to 0.9% (Harry Burn, Sound Shore Management). Not free-float ownership.
Who owns KD
Sorted by value, long equity only, as of 2026 Q2.
| History | |||||
|---|---|---|---|---|---|
| Harry Burn, Sound Shore Management | Reduce −39.6% | 2,504,350 | $28M | History |
Insider trades
Open-market buys and sales by KD's executives, directors and 10% owners in the last 12 months, from their Form 4s
- None no insider bought on the open market
- $177K sold by 1 insider outside a trading plan
- None no planned (10b5-1) sales
-
Vineet Khurana SVP & Global ControllerSale$177K 6,641 shares at $26.69 10% of stakeTraded Dec 5, 2025 Filed Dec 8, 2025
Also filed in the last 12 months, not counted as buying or selling: 32 share withholdings for taxes and 28 stock grants.
Congress
3 members of Congress traded KD in the last three years: 0 buys and 3 sales. 3 members listed it in 2025 annual reports.
-
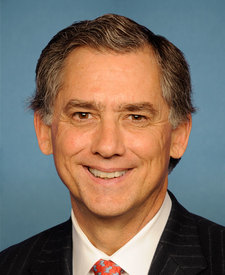 J. French Hill
Sell
$1K–$15K
Dec 31, 2025
filed Jan 23
-
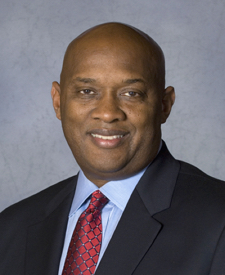 Dwight Evans
Sell
$224
Oct 10, 2025
filed Oct 30, 2025
-
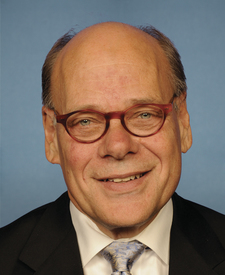 Steve Cohen
Sell
$1K–$15K
Dec 11, 2023
filed Jan 4, 2024
SEC filings
Recent issuer filings from EDGAR, 11 shown.
Financials
US-GAAP annual figures by fiscal year, as tagged in Form 10-K. Each value links to its SEC filing.
Balance sheet
| Metric | FY2023 | FY2024 | FY2025 | FY2026 |
|---|---|---|---|---|
| Total current assets | $4.96B | $4.75B | $4.59B | $5.53B |
| Total non-current assets * | $6.5B | $5.84B | $5.86B | $7.02B |
| Total assets | $11.46B | $10.59B | $10.45B | $12.55B |
| Total current liabilities | $4.87B | $4.59B | $4.3B | $6.31B |
| Total non-current liabilities * | $5.13B | $4.88B | $4.82B | $4.95B |
| Total equity | $1.36B | $1.02B | $1.22B | $1.18B |
Ownership over time
13Fs that reported it each quarter. Click a bar for that quarter’s holders.